Top Tools for Profiling Your Python Code and How to Use Them
Do you know how to Profile your Python code?
Code profiling measures the performance metrics of your code in terms of execution time, RAM, e.t c.
You can’t track what you don’t measure, and it’s the same with programs. The only way to determine any bottlenecks in your code is to measure. Once you have the results, you can do the necessary optimization.
This tutorial will cover the top tool you can use to profile your Python to measure performance.
timeit
timeit is a simple Python module used to measure the execution of small Python code. It is ideally great for small snippets of code. The syntax for timeit looks like this:
timeit.timeit(stmt='pass', setup='pass', timer=<default timer>, number=1000000, globals=None)Let’s start with a simple example to measure the time taken to get the square of a number.
import timeittotal_time =timeit.timeit('5**2')print(total_time)
In the code above, we import the timeit module and pass the code to be executed as a string to the timeit instance.
The output will be:
0.008359479999853647The timeit, by default, runs the code a million times to provide a more accurate execution time devoid of external factors. You can change the default number if you wish.
Let’s use a list comprehension to find the time taken to iterate a list of numbers.
import timeitmylist = [2,4,7,8,9,20,4]total_time =timeit.timeit('[a**2 for a in [2,4,7,8,9,20,4]]')print(total_time)
The output will be:
1.1033836580008938Let's profile a Python for loop.
The output will be:
0.044076934000258916cProfile
cProfile is the recommended module for profiling Python programs. It is used to determine how long it takes for code to execute. Suppose you have a function that does a specific task and notice that it’s running slow; the first step is understanding how each part of the function affects its performance.
You can do this with a cProfile
When you run a cProfile on any piece of code, it gives you the following metrics:
ncalls for the number of calls.
tottime for the total time spent in the given function (and excluding time made in calls to sub-functions)
percall is the quotient of tottime divided by ncalls
cumtime is the cumulative time spent in this and all subfunctions (from invocation till exit). This figure is accurate even for recursive functions.
percall is the quotient of cumtime divided by primitive calls
filename:lineno(function) provides the respective data of each function
The fastest way to use cProfile is by passing the function to be profiled as a string to the cProfile function as follows.
import cProfilecProfile.run('[a**2 for a in [2,4,7,8,9,20,4]]')
The output will be:
4 function calls in 0.000 secondsOrdered by: standard namencalls  tottime  percall  cumtime  percall filename:lineno(function)
        1    0.000    0.000    0.000    0.000 <string>:1(<listcomp>)
        1    0.000    0.000    0.000    0.000 <string>:1(<module>)
        1    0.000    0.000    0.000    0.000 {built-in method builtins.exec}
        1    0.000    0.000    0.000    0.000 {method 'disable' of '_lsprof.Profiler' objects}
You might want to save the profiling data. To do that, provide the filename argument and the file name to store the data.
import cProfilecProfile.run('[a**2 for a in [2,4,7,8,9,20,4]]', filename = 'results.prof')
The file will be stored in your current directory when you run the code.
You can also execute your profiler from the command line. Suppose the code is saved in the file profilling.py.
def num_squared():mylist = [2,4,7,8,9,20,4]for a in mylist: print(a**2)
Here is how you execute it from the command line:
python -m cProfile profiling.pyHere is the output:
3 function calls in 0.000 secondsOrdered by: standard namencalls  tottime  percall  cumtime  percall filename:lineno(function)
        1    0.000    0.000    0.000    0.000 perform.py:1(<module>)
        1    0.000    0.000    0.000    0.000 {built-in method builtins.exec}
        1    0.000    0.000    0.000    0.000 {method 'disable' of '_lsprof.Profiler' objects}
The output tells us that the profiler ran 3 function calls.
Let’s try another example that contains multiple functions nested together.
Here is the output:
Snakeviz
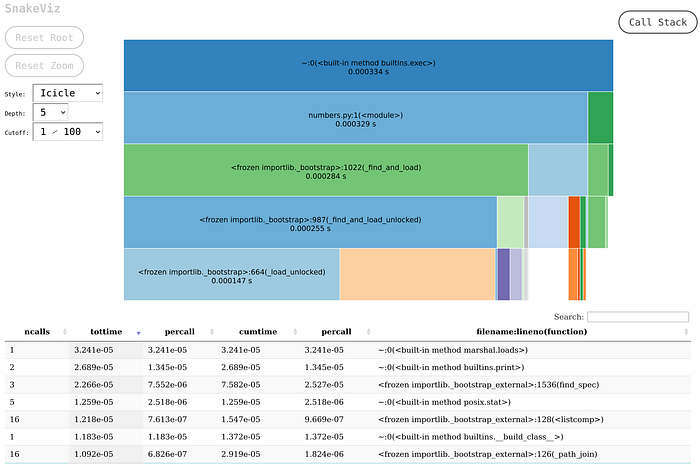
Would it be better if you could visualize this data on a chart?. SnakeViz is a visualization viewer for Python profiling data that runs as a web application in your browser.
First, install SnakeViz via pip or conda if you have Anaconda installed.
pip install snakevizWe will use the nested example above. Let’s first save the profiled data.
python -m cProfile -o results.prof numbers.pyNext, visualize the results.prof file with snakeviz
snakeviz results.profOnce your run the command above, the results will open in a browser at http://127.0.0.1:8080/, which looks like this:

If you are using a Jupyter notebook, load snakeviz at the top of the file.
%load_ext snakevizYappi
Yappi is a Python profiler that provides support for long-running multithreaded applications. It makes it possible to show the correct wall/CPU time or call count information per coroutine, which is impossible with other profilers.
Consider the example below for profiling an asyncio application taken from the Yappi GitHub page:
Conclusion
In this tutorial, we have covered how to use timeit, cProfile, and Yappi profilers, as well as visualizing profiled data using snakeviz. Other profiling tools you can try include palanteer, py-spy, and function-trace.
More content at PlainEnglish.io. Sign up for our free weekly newsletter. Follow us on Twitter and LinkedIn. Check out our Community Discord and join our Talent Collective.

